DUE: 11:59 PM FRIDAY, SEPTEMBER 4
Intro
For this assignment, you will create pretty (and, more importantly, informative) pictures of proteins. You will do this using PyMol.
The purpose of this assignment is to help you become familiar with pymol in a learning-by-doing fashion. You will have to create visualizations of three different example systems. For the first example, you will follow step-by-step instructions to create specific figures. As you work through the assignment, you will have to make figures with less guidance; the challenge will be for you to figure out how to make these figures yourself.
TIP: pymol is used ubiquitously by in the field of computational biology. Because of this, if you do not know how to do something in pymol, a quick google search will often give you helpful information. The pymol wiki is a great resource.
Submission
Upload your figures and descriptions to GradeScope. All figures must be ray traced. You may post process the images to add labels if you are unsatisfied with pymol labeling.
System 1: Protein Ligand Interactions (30 points)
You will be visualizing a crystal structure of a kinase protein (AKT1) bound to an allosteric inhibitor. This crystal structure was originally described in this paper, and the structure is publicly available under PDB ID 3O96.
The protein structure can be divided into two distinct domains: the PH domain, and the kinase domain. These two domains are linked by a disordered and flexible region of the protein comprised of residues 114-144. Figure 9 of the paper has a nice illustration of this, which I've shown below. The PH domain is colored orange and the kinase domain is colored yellow.
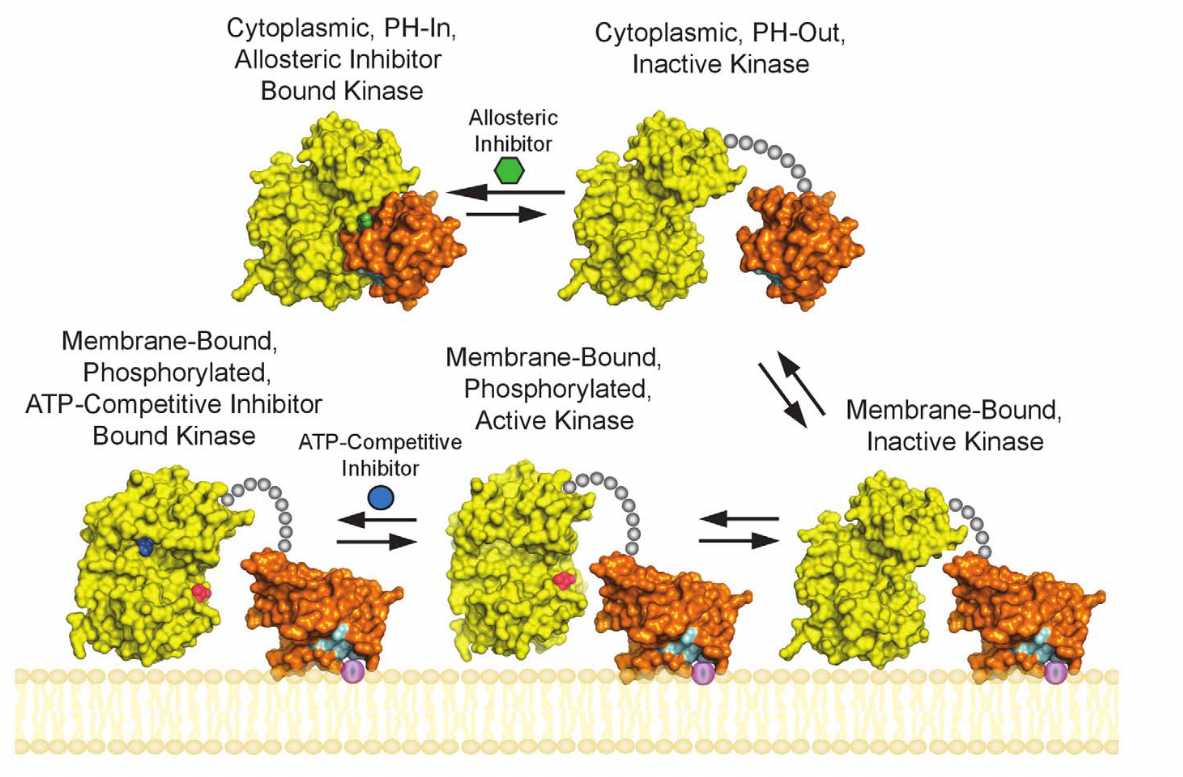
The PDB structure 3O96 is the allosteric inhibitor-bound structure at the top-left of the figure.
The authors further break down the kinase domain into two sub-domains referred to as the N-lobe and C-lobe. You are going to recreate figures from the paper that show these three domains, as well as a figure that illustrates the molecular interactions between these domains and the allosteric inhibitor.
Recreate Figure 3A (10 points)
Follow the instructions below to recreate figure 3a from the publication (which is not the figure shown above).
- open pymol
- load crystal structure into pymol
- at the pymol command line, run the following command:
fetch 3O96- to understand what this command is doing, take a look at the documentation for
fetch
- to understand what this command is doing, take a look at the documentation for
- at the pymol command line, run the following command:
- remove waters
- create selections that contain the separate protein domains shown in the figure\
- create a selection for the PH domain by running the following command:
select ph_domain, resi 1-123- This command creates a "named selection" named "ph_domain", which contains all residues with indices in the range 1-123
- Refer to this article to learn about the
selectcommand, theresiproperty selector, and other methods for selecting a subset of atoms. - Pymol also has "selection algebra" where you can combine property selectors via logical operations such as "and". This will be useful to you later.
- create a selection for the N-lobe of the kinase domain:
select nlobe_kinase, resi 124-230 - create a selection for the C-lobe of the kinase domain:
select clobe_kinase, resi 231-436
- create a selection for the PH domain by running the following command:
- color the protein domains as they are seen in figure 3A
- Next to the selection labeled (ph_domain) on the right-hand side, click the rainbow button with a "C" on it. On the menu that appears, click "oranges" and then "orange". In the rendering of the structure, you will see the PH domain (defined as the first 123 residues in the protein), is now orange.
- Set the color of the (nlobe_kinase) selection to "magentas > pink"
- Set the color of the clobe_kinase selection to "yellows > yellow"
- Rotate your view of the structure so that it looks like the orientation shown in figure 3A
- Make sure your Mouse Mode is set to "3-Button Viewing". You can see your current Mouse Mode in the bottom right-hand corner of the GUI. You can change the current Mouse Mode by selecting the "Mouse" dropdown menu at the top of your screen, and then selecting "3-Button Viewing"
- Use your mouse to click and drag the rendering so you recreate the orientation shown in figure 3A
- left-click and drag to rotate the structure
- right-click and drag to "zoom-in" and "zoom-out"
- middle-click and drag to "move" your view of the structure without rotating it
- Ray trace and export your current view of the structure to a 1200x900 png file
- Click on the "Draw/Ray" box at the top-right corner of the GUI (alternatively you can use the
raycommand) - In the subsequent menu that appears, select "Ray (slow)" and set the dimensions
- Select "Save Image to File".
- Click on the "Draw/Ray" box at the top-right corner of the GUI (alternatively you can use the
- Save a pymol session file (.pse) for this current view
- Click "File" at the top bar, then "Save Session As...", give the file a descriptive name.
- This will be useful later. To make the next figure, we are going to make changes to the current state of the structure. However, if you ever need to go back and make modifications to the structure for Figure 3A, you can load this pymol session file and pick up where you left off. Session files are generally useful if you need to close pymol or do something else in the same window but you might want to return to your current state at some point in the future.
- Click "File" at the top bar, then "Save Session As...", give the file a descriptive name.
Recreate Figure 3B (10 points)
Now you will recreate Figure 3B from the same publication. The primary difference between Figure 3A and 3B is the "representation" of the protein and the ligand. The entire protein has a cartoon representation in 3A and the kinase domain has a surface representation in 3B. The ligand has a stick representation in 3A and a sphere representation in 3B.
- Give the N-lobe kinase and C-lobe kinase domains a surface representation.
- For the each of the kinase domain selections (
nlobe_kinaseandclobe_kinase) do the following: click on the "S" button next to the selection on the right-hand side of the screen. In the menu that appears, click on "surface". This will only surface the exterior of the protein, which looks bad. To have the entire domain have a surface, even the parts that are in contact with the rest of the protein, go to Settings->Surface->Ignore Unsurfaced (alternatively you could extract the domains into their own objects).
- For the each of the kinase domain selections (
- Give the ligand a sphere representation.
- Click directly on the ligand. This will add it to the "default" selection which is named
seleand can be seen on the right-hand panel of the GUI.- In general, you can click directly on any part(s) of the rendered structure in pymol, and then manipulate these parts using the A, S, H, L, and C buttons next to
(sele)in the right-hand panel. - Note that
(sele)differs in behavior from named selections. The contents of(sele)is dependent on which structures you have recently clicked on. A full explanation is provided here.
- In general, you can click directly on any part(s) of the rendered structure in pymol, and then manipulate these parts using the A, S, H, L, and C buttons next to
- Click on the "S" button next to
(sele)and then select "Spheres"
- Click directly on the ligand. This will add it to the "default" selection which is named
- Ray trace and export your current view of the structure to a 1200x900 png file and save a pymol session file
- follow the same steps as you did when making figure 3A
Recreate Figure 5B (10 points)
Molecular interactions that dictate whether a ligand will bind to a protein are often driven by interactions with side-chain atoms. It is often informative to analyze side-chain atoms close to the ligand. Figure 5 of the paper does exactly this. Up until now, we have not visualized any side-chain atoms. The surface representation does not show individual atoms. The cartoon representation is comprised only of backbone atoms.
- Hide the surface and sphere representations
- Click on the "H" button next to 3O96 on the right-hand side. Then click in "surface". Repeat this process again but click on "spheres"
- "H" stands for "Hide"
- Click on the "H" button next to 3O96 on the right-hand side. Then click in "surface". Repeat this process again but click on "spheres"
- Make the N-lobe kinase domain yellow
- Create a named selection for the ligand
- Select the ligand by clicking directly on it
- Click on the "A" button next to
(sele)in the control panel, then click "rename", and rename this selection "ligand"
- Create a named selection for the residues from the PH domain that interact with the ligand
- Run the following command:
select sc_ph, byres ph_domain within 5 of ligand- This command creates a selection named
sc_phwhich contains all residues that are in the PH domain and have atoms within 5 angstroms of the ligand. - The documentation on selection algebra describes the
byresandwithinoperators - Alternatively, you could explicitly select a set of discontinuous residues using something like this:
select sc_ph, resi 80+82+84+296. However, this requires manually finding the residues of interest first.
- This command creates a selection named
- Run the following command:
- Create a named selection for the residues from the kinase domain that interact with the ligand
- Run the following command:
select sc_kinase, byres (nlobe_kinase or clobe_kinase) within 4 of ligand
- Run the following command:
- Show side chains for the residues
- For each of the named selections you just created, click on the "S" buttons next to their names on the right-hand side of the GUI, and select "side chain", and then "sticks".
- Color the side chains by element
- Click the "C" button next to
(sc_kinase). Select "by element" and then the option with cyan carbon atoms (the 3rd option from the top). - Click the "C" button next to
(sc_ph). Select "by element" and then the option with magenta carbon atoms (the 4th option from the top).
- Click the "C" button next to
- Label the residues with sidechains displayed
- For each of the selections made in steps 3 and 4, select the "L" button on the right-hand panel of the GUI, and then select "residues" from the menu that appears.
- Orient your view around the ligand
- Select the ligand by clicking directly on it
- Click the "A" button next to
(sele)on the right-hand side panel, and then select "orient" - Rotate the protein to approximate the same view seen in Figure 5 from the paper
- Adjust clipping to to more clearly see the ligand + side chains
- "Clipping" means that atoms that are either a certain distance away from the current view, or too close to the current view, are hidden. This can facilitate looking "inside" sections of a protein.
- You can adjust clipping thresholds easily by scrolling your mouse wheel. Alternatively, you can click "Display" at the navigation bar at the top of your screen and then select "Clipping".
- Adjust the clipping so that you can easily see most of the displayed sidechains.
- Ray trace and export your current view of the structure to a 1200x900 png file and save a pymol session file
System 2: Protein-Protein Interaction (30 points)
We will be visualizing the protein-protein binding interaction that enables SARS-CoV-2 to enter host cells. SARS-CoV-2 has spike proteins on its outer membrane that bind to the ACE2 receptor on host cells. A visualization of this process is shown below.
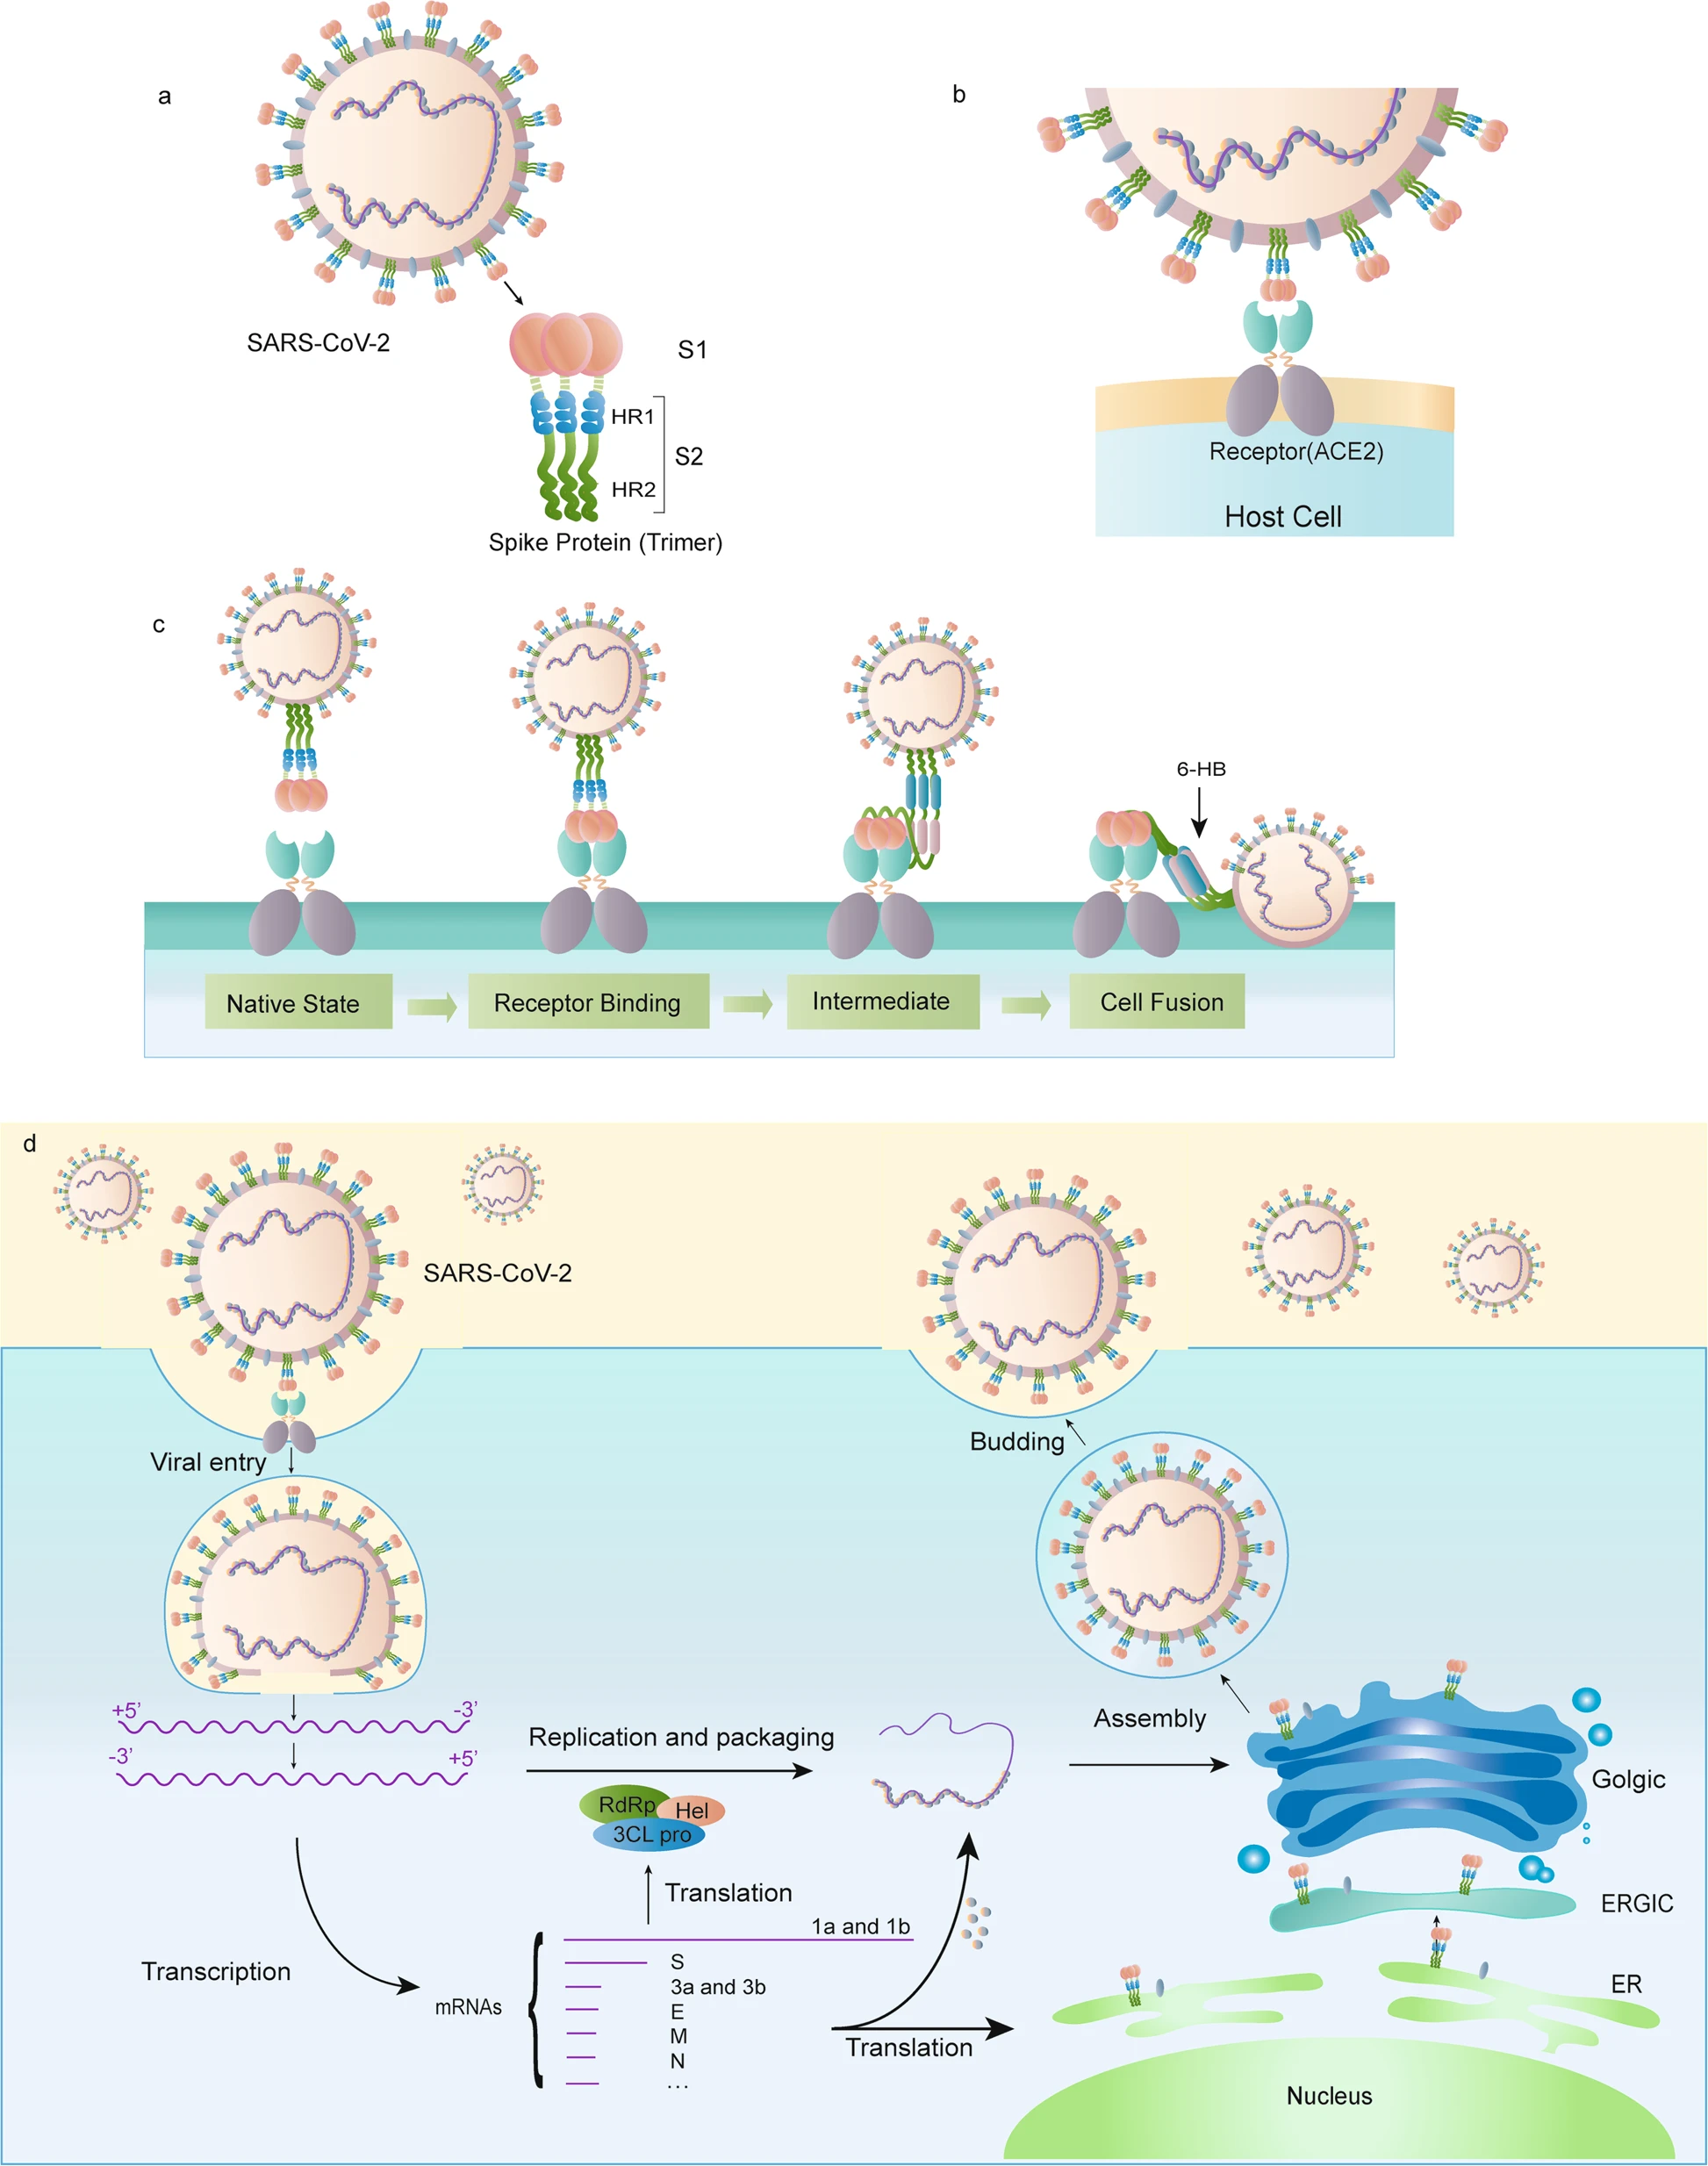
Figure 1 from Huang et. al. 2020
The spike protein has a subdomain known as the Receptor Binding Domain (RBD) which is the part of the protein that directly binds to ACE2 receptors. The structure of the RBD relative to the entire spike protein is shown in the figure below.
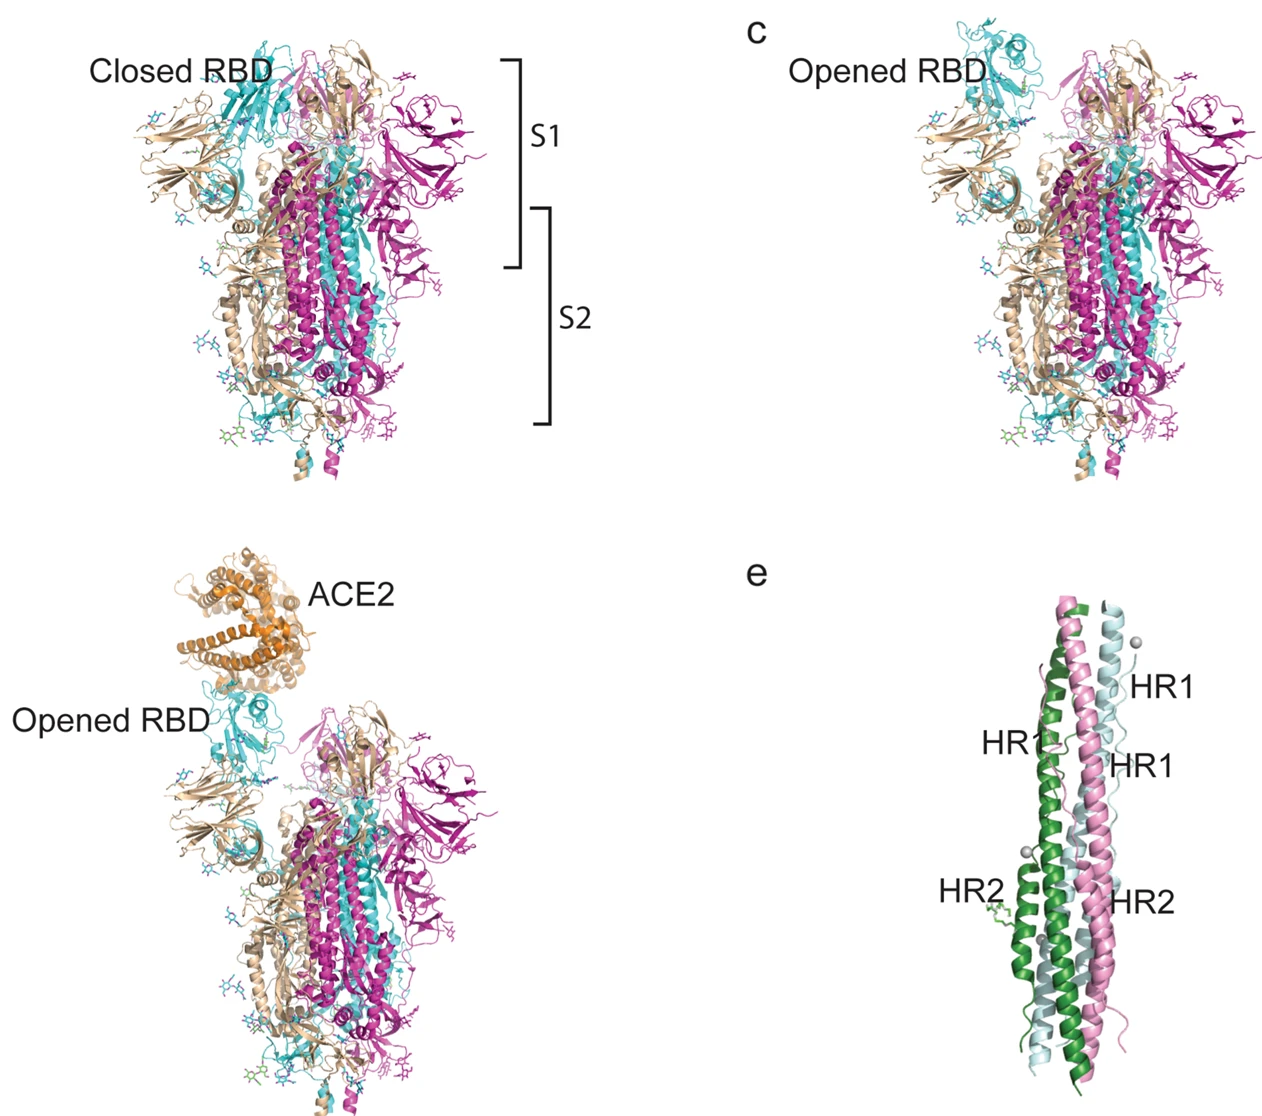
Figure 2 from Huang et. al. 2020
The RBD is a critical component of the virus' life cycle. The RBD is also targeted by antibodies produced by the immune system. Unsurprisingly, it has been found that the new SARS-CoV-2 variants that have emerged throughout the pandemic possess several key mutations to the RBD. Structural biologists have produced crystal structures of the RBD bound to ACE2. You are going to visualize these interactions, and compare the binding of the wild-type (WT) RBD with that of the Omicron variant.
You are to recreate the first two columns Figure 1D (4 images in total) from Lan et. al. 2022
The crystal structures you will need are listed in the table below:
| PDB ID | Description |
|---|---|
| 7WHH | Omicron RBD-ACE2 complex |
| 6M0J | WT RBD-ACE2 complex |
You are going to have to figure out how to recreate Figure 1D on your own. Your resulting figure should be ray traced. But here are a few tips:
- Each of these crystal structures contains two amino acid chains: one chain for ACE2, and one chain for RBD. These chains can be selected for in pymol using the identifiers "chain A" and "chain E", respectively. Note that pymol's
chainis the chain name the authors assigned; the PDB also assigns its own systematic identifier, which pymol displays as the segid (the RBD's segid is B). Select onchain, notsegi.
- For example, to create a named selection for the RBD, you would run a command like this:
select rbd, chain E - To select residue number 346 in the RBD domain, you could run the following command:
select rbd_residue, rbd and resi 346
- For example, to create a named selection for the RBD, you would run a command like this:
Lan et. al. 2022 provides a detailed comparison of these two structures. In your submission, write a self-contained caption (in your own words, not Lan et. al's) summarizing the key differences between the Omicron and WT complexes.
System 3: Protein Conformation Changes (20 points)
Gated ion-channel proteins are transmembrane proteins that can move between "open" and "closed" conformations to control the movement of ions in/out of a cell. We are going to give you an open and closed structure of one such protein: the alpha-1 glycine receptor. Your task is to create an attractive visualization that clearly shows the key differences between the open and closed structures.
| PDB ID | Description |
|---|---|
| 6PM0 | OPEN glycine receptor |
| 3JAD | CLOSED glycine receptor |
The representation of the structures is completely up to you. Take some time to look at them. Align the two structures in pymol using the pymol align command or the super command. Experiment with the measurement wizard. Each of the PDB structures has a publication associated with it. Feel free to look over those publications and take inspiration from their figures. You may combine multiple figures into a single image. You can find the publications by searching the PDB IDs on rcsb.org.
Include a few sentences describing your figure and its salient features. What should a reader extract from your figure that differentiates the two structures?