Answer these questions on the whiteboard (or paper). You may work in a group of 2 or 3. Be sure to verify your solution with a TA/instructor before leaving. You should use the $Z = \frac{1}{\lambda}\hat{Z}$ identity to focus your analysis on the configurational partition function.
Check: Double Square Well Potential
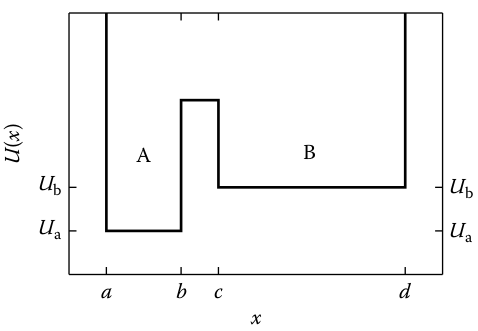
For each state A and B, what is Z, F, and S (in terms of $a, b, c, d, U_a, U_b$)?
Comparing the states, what are ΔF and ΔS?
Show all work on the whiteboard. You may work in groups of 2 or 3. Once your work is verified by course staff, upload a photo to GradeScope.
Check+: Protein Folding
We can model protein folding as a two state process using the double well potential.
The energy of the folded state is $U_f = U_a$ and the well width is $l_f = (b-a)$. Similarly, the unfolded state has energy $U_u = U_b$ and width $l_u = (d-c)$. Assume $r = \frac{l_f}{l_u}$ and $\Delta U = U_u-U_f > 0$ (folded state is lower entropy and energy just as shown in the figure).
Convince yourself the following expressions for the probability of the folded and unfolded states are correct (recall that the probability of state $i$ is proportional to $e^{-\frac{F_i}{k_BT}}$ and $r$ is the ratio of the well widths).
$$p_\mathrm{f} = \frac{r}{r+e^{\frac{-\Delta U}{k_bT}}}$$
$$p_\mathrm{u} = \frac{e^{\frac{-\Delta U}{k_bT}}}{r+e^{\frac{-\Delta U}{k_bT}}}$$
Using your favorite graphing program (which should be matplotlib) plot the relationship between temperature and $p_f$ with $\Delta U = 2\text{kcal/mol}$ and for the values of $r = 0.0001, 0.001, 0.01, 0.1$. Make sure each line in your plot is labeled with its $r$ value and the x and y axes are labeled. $T$ should range from 0 to 1000 K.
Solve for $T_m$, the temperature where $p_f(T) = p_u(T)$.
Given $T_m$ and $r$, solve for $\Delta U$.
For $T_m = 300\mathrm{K}$, calculate the required $\Delta U$ for values of $r = 0.0001, 0.001, 0.01, 0.1$ and plot the relationship between $T$ and $p_f$. Each line should be labeled with both its $r$ value and $\Delta U$ in kcal/mol (make sure you use the correct $k_B$). $T$ should range from 0 to 1000 K.
Upload your two graphs to GradeScope a short plain English description of how the melting curves are affected by changes in $\Delta S$.